 en
en  fr
fr
GOVERNANCE

PEOPLE

ENVIRONMENT

SOCIETAL
Corporate Social Responsibility (CSR) has always been at the heart of our values and concerns, and has been since 1968. In 2012, for the first time, we talked about our CSR approach in our annual report and began to describe the initiatives and achievements of our employees and management teams in the areas of governance, the environment and social responsibility.
In 2021, the Executive Committee selected 19 key indicators that reflect our commitments and the Group’s desire to be part of the long term by structuring its continuous improvement approach around priority issues. The indicators are based on four key areas: governance, people, the environment and society. The 2025 and 2030 horizons chosen reflect the commitment of the current management of Thermador Groupe through to the retirement of most of its members. These objectives have been discussed and challenged by the Sustainable Development committee and presented to our Board of Directors.
Each priority is translated into a quantified objective and tracked in our consolidated indicators, enabling everyone to monitor changes in our extra-financial performance.
This work highlighted the need for human resources to carry out these action plans. This led in 2022 to the creation of a Sustainable Development Unit at Executive Committee level.
OUR KEY EXTRA-FINANCIAL FIGURES
PRIORITIES & OBJECTIVES
| INDICATEURS | 2022 Réel | 2023 Réel | Avancement | Objectifs 2025 | Objectifs 2030 | |
| GOUVERNANCE | ||||||
| 1 | Taux de présence au Conseil d’Administration | 98,80% | 95,20% |
| ≥ 95 % | ≥ 95 % |
| 2 | Taux de participation à l’Assemblée Générale | 74,10% | 76,30% |
| ≥ 68 % | ≥ 73 % |
| 3 | Part du capital détenue par les salariés et anciens salariés | 7,00% | 6,70% |
| ≥ 8,0 % | ≥ 8,5 % |
| 4 | Pourcentage des salariés exposés formés sur les 3 dernières années à l’anticorruption | 96,90% | 98,70% |
| ≥ 95 % | ≥ 95 % |
| HUMAIN | ||||||
| 5 | Index égalité professionnelle (x/100) | 86 | 89 |
| ≥ 90 | ≥ 90 |
| 6 | Femmes à des postes de direction | 41,50% | 42,90% |
| ≥ 40 % | ≥ 40 % |
| 7 | Ancienneté moyenne (années) | 9,7 | 9,6 |
| ≥ 8 | ≥ 8 |
| 8 | Pourcentage de salariés CDI formés par année (y compris formations internes) | 80,80% | 96,40% |
| ≥ 95 % | ≥ 95 % |
| 9 | Absentéisme (y compris longues maladies) | 3,50% | 5,50% |
| < 4 % | < 4 % |
| ENVIRONNEMENT | ||||||
| 10 | Scope 1 - Émissions directes - flotte de véhicules (Teq CO2 par véhicule) | 2,69 | 2,58 |
| < 2,19 | < 1,36 |
| 11 | Scope 1 - Émissions directes - chauffage et rafraîchissement des bâtiments (Teq CO2 par km² | 5,01 | 3,95 |
| < 4,56 | < 3,82 |
| 12 | Scope 2 - Émissions indirectes dues à la consommation d’énergies des bâtiments (Teq CO2 par km²) | 1,03 | 0,75 |
| < 0,81 | < 0,44 |
| 13 | Scope 3 - Émissions indirectes dues à nos produits et nos activités (kTeq CO2) | 6,08 | 6,12 |
| < 2 % | < 17 % |
| 14 | Déchets liés à nos activités (kg/tonnage réceptionné) | 22,83 | 22,97 |
| < 20,71 | < 18,72 |
| 15 | Revalorisation des déchets | 95,70% | 99,40% |
| ≥ 90 % | ≥ 95 % |
| SOCIÉTAL | ||||||
| 16 | Pourcentage de CA réalisé auprès de fournisseurs notés | 74,10% | 89,90% |
| ≥ 80 % | ≥ 85 % |
| 17 | Pourcentage de CA réalisé auprès de fournisseurs certifiés ISO 9001 ou 14001 | 87,40% | 90,20% |
| ≥ 85 % | ≥ 90 % |
| 18 | Pourcentage de CA réalisé par des filiales ISO 9001 ou 14001 | 34,10% | 65,10% |
| ≥ 70 % | ≥ 90 % |
| 19 | Pourcentage de CA réalisé auprès de fournisseurs signataires de notre Charte achats responsables ou d’une charte équivalente | 85,50% | 92,10% |
| ≥ 85 % | ≥ 90 % |
![]() : Targets met -
: Targets met - ![]() : Targets in progress
: Targets in progress
![]() : Behind targets - Teq CO2 : tonnes of CO2 equivalent
: Behind targets - Teq CO2 : tonnes of CO2 equivalent
Managing our CSR priorities and performance
The CSR performance of the Thermador Groupe subsidiaries is the responsibility of the subsidiary CEO. It is the result of the consolidation of the performance of our subsidiaries. Each subsidiary works with its management committee to set its own objectives and determine an action plan specific to its subsidiary. Sharing best practice will help to standardise performance. The table of these 19 priorities is drawn up subsidiary by subsidiary and thus enables the subsidiary CEOs to benchmark each other.
The variable earnings of our corporate officers and subsidiary and group managers will now depend on the results achieved on each priority.
The resources committed to implementing the transition plans for the Group and its subsidiaries, ensuring its extra-financial performance and, ultimately, the company’s long-term viability, are of various kinds: training at all levels, which is essential to a successful fulfilment of the exercise, earnings of dedicated teams, external support and tools. They are presented in the Extra-Financial Performance Statement.
GOVERNANCE: RESPECTING ETHICAL PRINCIPLES AND COMPLIANCE

From the very beginning, the founders of Thermador established rules of operation based on transparency, exemplarity and honesty. Since 1968, we have been able to maintain these values and uphold our excellent reputation. The Group conducts its business with the utmost integrity.
Thermador Groupe has always placed ethics at the heart of its relations with its employees and all its stakeholders.
PEOPLE: GROWING OUR TEAMS


| INDICATORS | 2022 ACTUAL | 2023 ACTUAL | ACHIEVEMENT | TARGETS 2025 | TARGETS 2030 | |
| GOVERNANCE | ||||||
| 1 | Attendance rate at the Board of Directors | 98,80% | 95,20% |
| ≥ 95 % | ≥ 95 % |
| 2 | Participation rate in the AGM | 74,10% | 76,30% |
| ≥ 68 % | ≥ 73 % |
| 3 | Employee ownership | 7,00% | 6,70% |
| ≥ 8,0 % | ≥ 8,5 % |
| 4 | Percentage of exposed employees trained in anti-corruption over the last 3 years | 96,90% | 98,70% |
| ≥ 95 % | ≥ 95 % |
| HUMAN | ||||||
| 5 | Professional equality index (x/100) | 86 | 89 |
| ≥ 90 | ≥ 90 |
| 6 | Women in management positions | 41,50% | 42,90% |
| ≥ 40 % | ≥ 40 % |
| 7 | Average seniority (years) | 9,7 | 9,6 |
| ≥ 8 | ≥ 8 |
| 8 | Percentage of permanent employees trained per year (including internal training) | 80,80% | 96,40% |
| ≥ 95 % | ≥ 95 % |
| 9 | Absenteeism (including long-term sickness) | 3,50% | 5,50% |
| < 4 % | < 4 % |
| ENVIRONMENT | ||||||
| 10 | Scope 1 - Direct emissions - vehicle fleet (eq T CO2 per vehicle) | 2,69 | 2,58 |
| < 2,19 | < 1,36 |
| 11 | Scope 1 - Direct emissions - heating and cooling of buildings (eq T C02 per km2) | 5,01 | 3,95 |
| < 4,56 | < 3,82 |
| 12 | Scope 2 - Indirect emissions from energy consumption of buildings (eq T CO2 per km2) | 1,03 | 0,75 |
| < 0,81 | < 0,44 |
| 13 | Scope 3 - Indirect emissions from products and activities (eq kT CO2) | 22,83 | 22,97 |
| < 2 % | < 17 % |
| 14 | Waste from our activities (kg/tonnage received) | 22,83 | 20,28 |
| < 20,71 | < 18,72 |
| 15 | Waste recovery | 95,70% | 99,40% |
| ≥ 90 % | ≥ 95 % |
| SOCIETAL | ||||||
| 16 | Percentage of turnover from rated suppliers | 74,10% | 89,90% |
| ≥ 80 % | ≥ 85 % |
| 17 | Percentage of turnover achieved with ISO 9001 or 14001 certified suppliers | 87,40% | 90,20% |
| ≥ 85 % | ≥ 90 % |
| 18 | Percentage of turnover achieved by ISO 9001 or 14001 subsidiaries | 34,10% | 65,10% |
| ≥ 70 % | ≥ 90 % |
| 19 | Percentage of turnover from suppliers who are signatories to our Supplier Code of conduct or an equivalent charter | 85,50% | 92,10% |
| ≥ 85 % | ≥ 90 % |
Our teams have always been at the heart of our value chain
Below is Distribution of functions:
36% women
Talent development

Diversity, inclusion and equal opportunities


Value sharing
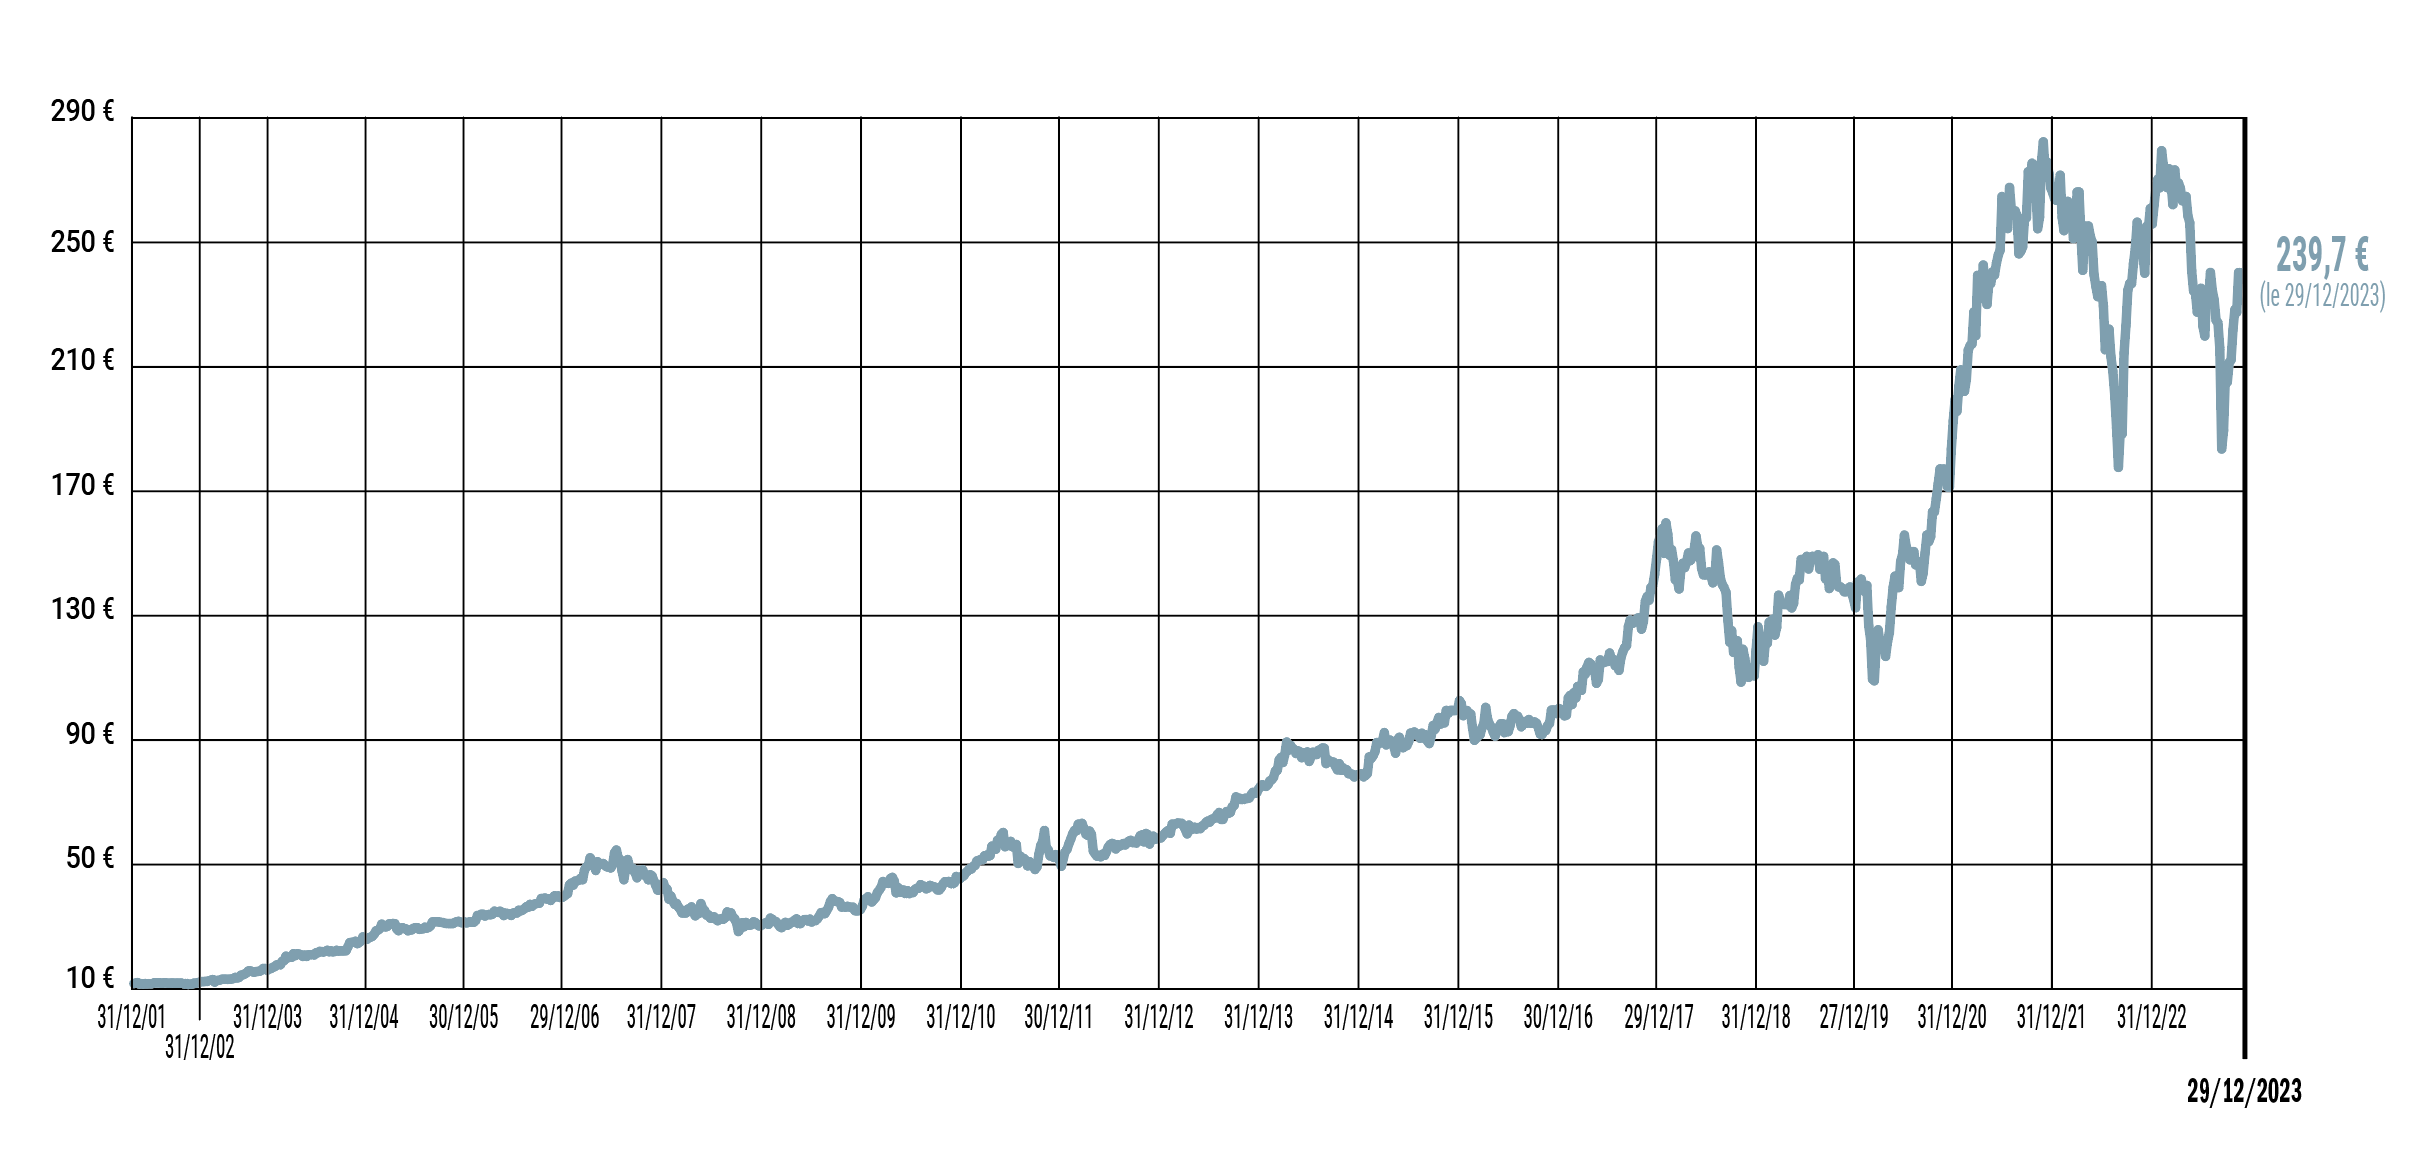
Variation of one share in the Thermador Groupe FCPE (Mutual fund)
ENVIRONMENT: CONTRIBUTING TO THE ECOLOGICAL TRANSITION


| ACTIONS | 2023 | TARGETS 2025 | TARGETS 2030 |
| Training of the Codir on environmental responsibility | 100 % | 100 % | 100 % |
| Percentage of turnover committed to a detailed Scope 3 assessment | 97 % | 80 % | 100 % |
| SCOPE 1: emissions from our vehicle fleet (tCo2e/vehicle) | 2.58 | 2.19 | 1.38 |
| SCOPE 1: heating and cooling of buildings (tCo2e/1000m2 ) | 3.95 | <5.70 | <4.44 |
| SCOPE 2: energy consumption of buildings (tCo2e/1000m2 | 0.75 | <0.94 | <0.83 |
| SCOPE 3: indirect emissions from our products and activities (tCO2e/t of products shipped) | 6.20 | 5.95 | 5.05 |
| Waste from our activities (kg/t received) | 22.97 | <20.71 | <18.72 |
| % of waste sent for recycling | 99.4 % | 80 % | 95.8 % |
Our climate strategy
Thermador Groupe and its subsidiaries are committed to combating climate change. Our climate strategy is based on the three pillars outlined in this chapter: mitigating our carbon emissions and those of our value chain, compensating for emissions that we cannot reduce in the short term and adapting to the effects of climate change.
We made major progress in 2023 on carbon emissions from our upstream value chain, by developing a Scope 3 carbon objective linked to products and initiating work on our suppliers' commitment thereto, as well as mapping the exposure of our sites and those of our suppliers to physical risks according to the IPCC scenarios. Other areas for progress include the reliability of our carbon footprint - in continuous improvement - and our energy efficiency plans.
We have been measuring our carbon footprint since 2021. The methodology applied follows the requirements of ISO 14064 and is detailed in this chapter.
Mitigating our carbon emissions
We measure our carbon footprint on the 3 Scopes, as required by the ISO 14064 standard and the ADEME’s (French environment agency) BGES methodology, with support from an independent agency, I Care.
Our calculation methodology is based on the turnover of each subsidiary, the weight of the products, the materials they are made of, the power consumed and rate of use (for products consuming energy) and origin.
We use the CO2 emission factors defined and validated by ADEME, as we do not have access to more precise information.
The objective is for all subsidiaries to measure their carbon footprint, and then the footprint is extrapolated for the following two years and measured again in the fourth year. Each year, we broaden our scope by including new subsidiaries.

Our objectives
In 2021, we set ourselves four targets for reducing CO2 emissions. To allow us to monitor our operational progress, we linked them to measurable actions, as shown in the table in the introduction. In 2023, our carbon emissions were 20.8% lower than in 2022 in absolute terms. Concerning targets linked to our operations, in 2023, emissions are down by nearly 10% on Scopes 1 and 2; so, we have made progress on three of our four objectives. This progress is linked to our investment policy to reduce energy consumption in our buildings as well as our efforts to contribute to the energy-saving plan, reflected in lower electricity and gas consumption. As for the decrease linked to travel, this trend should be reversed through the renewal of our fleet of vehicles with electric and hybrid vehicles. In 2023, we set ourselves a Group-wide emissions reduction target for Scope 3 relating to products. This is expressed in terms of carbon intensity, i.e. tonnes of carbon emissions per tonne of products shipped. This reduction is based on the work presented below and will be closely linked to the efforts made by and with our partners: our suppliers for the design, materials and manufacture of products, and our service providers for upstream and downstream transport. It will also depend on the national energy mix for the use of our active products and the end of the product’s life. In 2024, each subsidiary will assess its reduction potential through its action levers.
Our action plan
Our contribution to the circular economy
Having decided to launch an eco-design approach in 2021, five of our subsidiaries (Sferaco, Thermador, PBtub, Axelair and Sectoriel) volunteered to implement an eco-design approach for their products from 2022, thereby helping to improve the environmental performance of product ranges in their respective markets (buildings and industry). Eco-design is the integration of environmental aspects into product design and development, with the aim of reducing negative environmental impacts throughout the product's life cycle, while providing equivalent or better service. This approach aims to find the best balance between environmental, social, technical and economic requirements.
Ours actions to preserve water resources

The droughts of the summer of 2022 and 2023 reminded us how precious water resources are. Our actions to preserve the resource concern our own operations and our customers', through the use of the products we sell. Indeed, several of our subsidiaries are experts in water management and recovery.
Our actions to preserve biodiversity

We have always been mindful of our surroundings and protected the ecosystems around our sites. We work with local stakeholders: municipalities, local communities, our neighbours and associations. Since 2015, the Association Porte d’Isère Environnement (APIE) has been supporting most of our subsidiaries located in Saint-QuentinFallavier within the framework of a long-term partnership providing the services of nature experts. APIE is the environmental protection association for the Nord Isère region, a member of FNE (France Nature Environment) and a contact for local authorities, administrations and companies. APIE’s three main lines of action are: learning about the territory in order to preserve it, preventing and reducing environmental damage, and improving the living environment.
SOCIETAL: BEING A RESPONSIBLE AND COMMITTED PARTNER FOR OUR STAKEHOLDERS

| INDICATORS | 2023 | TARGETS 2025 | TARGETS 2030 |
| FIGHT AGAINST CORRUPTION | 98.7 % | ≥ 95 % | ≥ 95 % |
| Percentage of exposed employees trained over the last 3 years in anti-corruption. | |||
| SHARE OUR ETHICAL REQUIREMENTS WITH OUR SUPPLIERS | 92.1 % | ≥ 85 % | ≥ 90 % |
| Percentage of turnover generated from suppliers who are signatories to our Suppliers’ code of conduct or an equivalent one. | |||
| RESPONSIBLE TAXATION | |||
| Share of our taxes paid in France. | 95.8 % | Board of Directors’ commitment to responsible taxation | |
| Share of our taxes paid in Belgium. | 2.3 % | ||
| Share of our taxes paid in Spain. | 1.3 % | ||
| Share of our taxes paid in the Nederlands. | 0.6 % | ||